Statistics and Form: Track the Ice Hockey Player’s Progress Over Time


Statistics and Form: Track the Ice Hockey Player’s Progress Over Time
Ice hockey may not be India’s most familiar sport, but its speed, precision, and strategy make it fascinating to follow—especially as the game gains attention through international tournaments and streaming platforms. For fans, analysts, and even those exploring sports data for betting or fantasy leagues, understanding how a player’s form evolves over time is key. Statistics offer a powerful lens for this, but numbers alone never tell the full story.
Statistics as a Guide – But Not the Whole Picture
Ice hockey is rich in measurable data: goals, assists, plus/minus ratings, shots on goal, time on ice, and faceoff percentages, among others. These figures help describe a player’s performance, yet they don’t capture everything. A forward might not score often but could still be vital in creating space, pressing opponents, or contributing defensively.
To truly understand progress, it’s better to look at trends rather than single-game results. A rising number of shots or an increase in ice time can signal improving form even before goals appear. Conversely, a drop in these numbers might suggest fatigue, tactical changes, or a dip in confidence.
Form Curves and Context
Form in sport is fluid. A player can go through a “hot streak” where everything clicks, followed by a stretch where nothing seems to work. Statistics can help identify these patterns, but context is essential.
Is the player returning from injury? Has the coach changed the line combinations? Is the team playing a more defensive system? Each of these factors influences the numbers. That’s why combining statistical analysis with observation—watching highlights, reading match reports, or following expert commentary—gives a more complete picture.
Advanced Metrics: Corsi, Fenwick, and Expected Goals
Modern ice hockey analysis has embraced advanced metrics that go beyond traditional stats. Corsi and Fenwick measure shot attempts for and against while a player is on the ice, offering insight into puck possession and territorial play. Expected goals (xG), on the other hand, evaluates the quality of scoring chances based on shot location and type.
These metrics can reveal hidden strengths. A player with a high xG but few goals might simply be unlucky, suggesting that scoring is likely to improve soon. For coaches, scouts, and data-driven fans in India exploring the sport, such insights can make following ice hockey far more engaging.
Læs også:


The Mental and Physical Dimensions
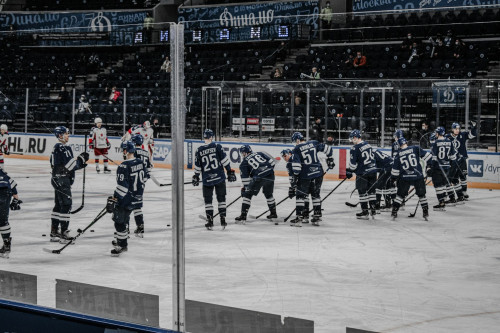
Numbers can’t capture everything. A player’s form is also shaped by mental and physical factors—motivation, fatigue, confidence, and team chemistry. A player logging heavy minutes might see declining efficiency, even if the stats don’t immediately show it.
That’s why it’s useful to follow interviews, team updates, and coach statements. These sources often reveal how a player feels and what might influence their upcoming performances.
How to Track Progress Over Time
If you want to follow an ice hockey player’s development systematically, consider these steps:
- Compare time periods – Look at stats over 5, 10, or 20 games to identify trends.
- Monitor ice time and role – Shifts in playing time or line assignments can explain changes in output.
- Study opponents – Some players perform better against certain teams or styles.
- Blend data with observation – Use both numbers and visual analysis for a balanced view.
By combining statistical trends with an understanding of the game’s rhythm, you can form a more nuanced view of where a player stands—and where they might be heading.
From Numbers to Insight
Tracking an ice hockey player’s progress isn’t just about counting goals and assists. It’s about interpreting how performance evolves through data, context, and human factors. Statistics are tools, not verdicts. When you learn to read them in context, you gain a deeper appreciation of the sport—and a sharper sense of what “form” truly means on the ice.
Læs også: